Stable Diffusion GPU Performance Chart
Mar 24, 2023
Community driven Stable Diffusion GPU performance benchmark, comparing Nvidia/AMD/Intel/Apple hardware
How to read it?
When you are generating an image you are setting a sampling steps, generating a 20 steps image with speed of 10it/s will take 2 seconds. it/s are mainly depended on those factors:
- Resolution
- Sampler
- Tokens amount
Usual sampling step value is 15-30, from some samplers like DPM++ 2SDE you can get as low as 5 steps, but it’s quite a lot slower than regular sampler.
Available Benchmarks
There are currently 3 known benchmarks for Stable Diffusion:
-
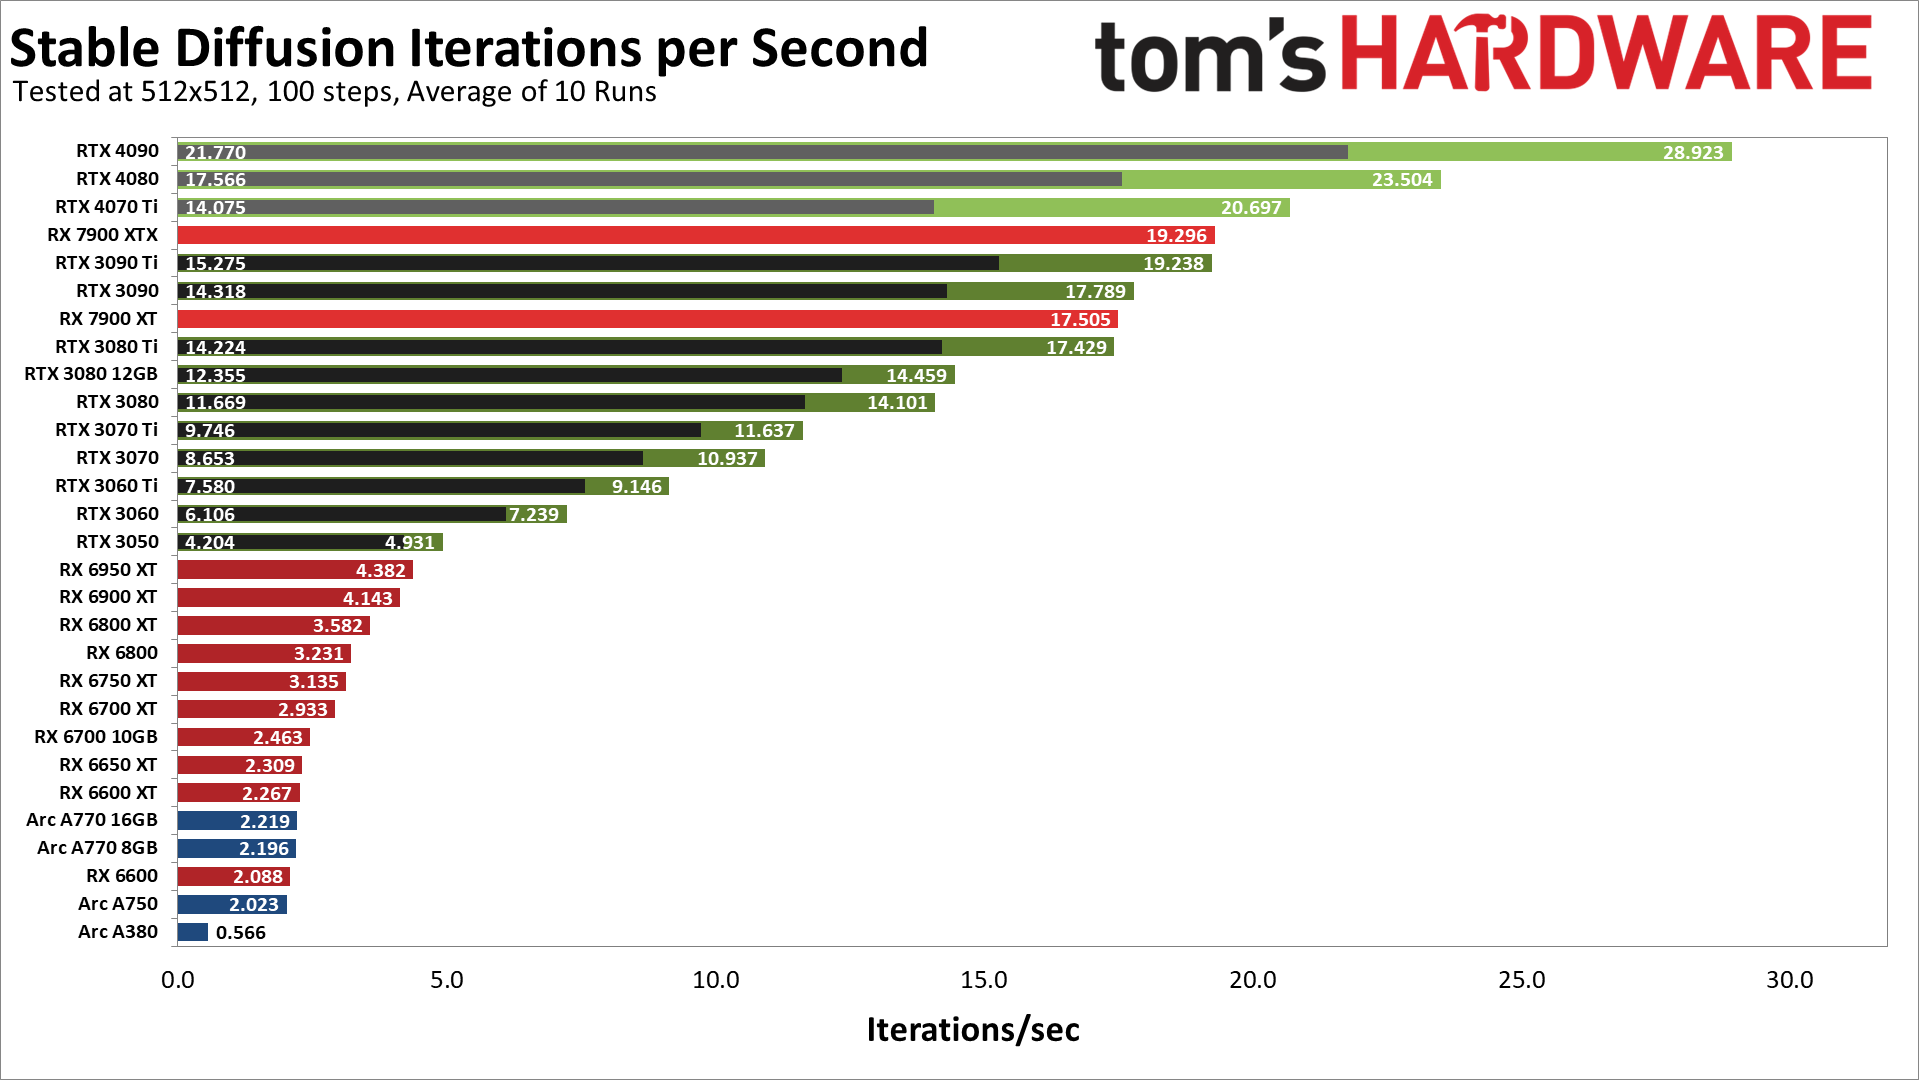
Tom’s Hardware Which is probably the worst, the results are inaccurate, and the testing method is very unusual, RTX 4090 shows half of its performance.
-
Vladmandic Data is gained via extension which is the proper way to do this, but data isn’t visualized, so it’s quite hard to browse it, but the weirdest stuff is the benchmarking itself
"Performance is measured as iterations per second for different batch sizes (1, 2, 4, 8 ...) and using standardized txt2img settings"results are all over the place, and does not align with this statement.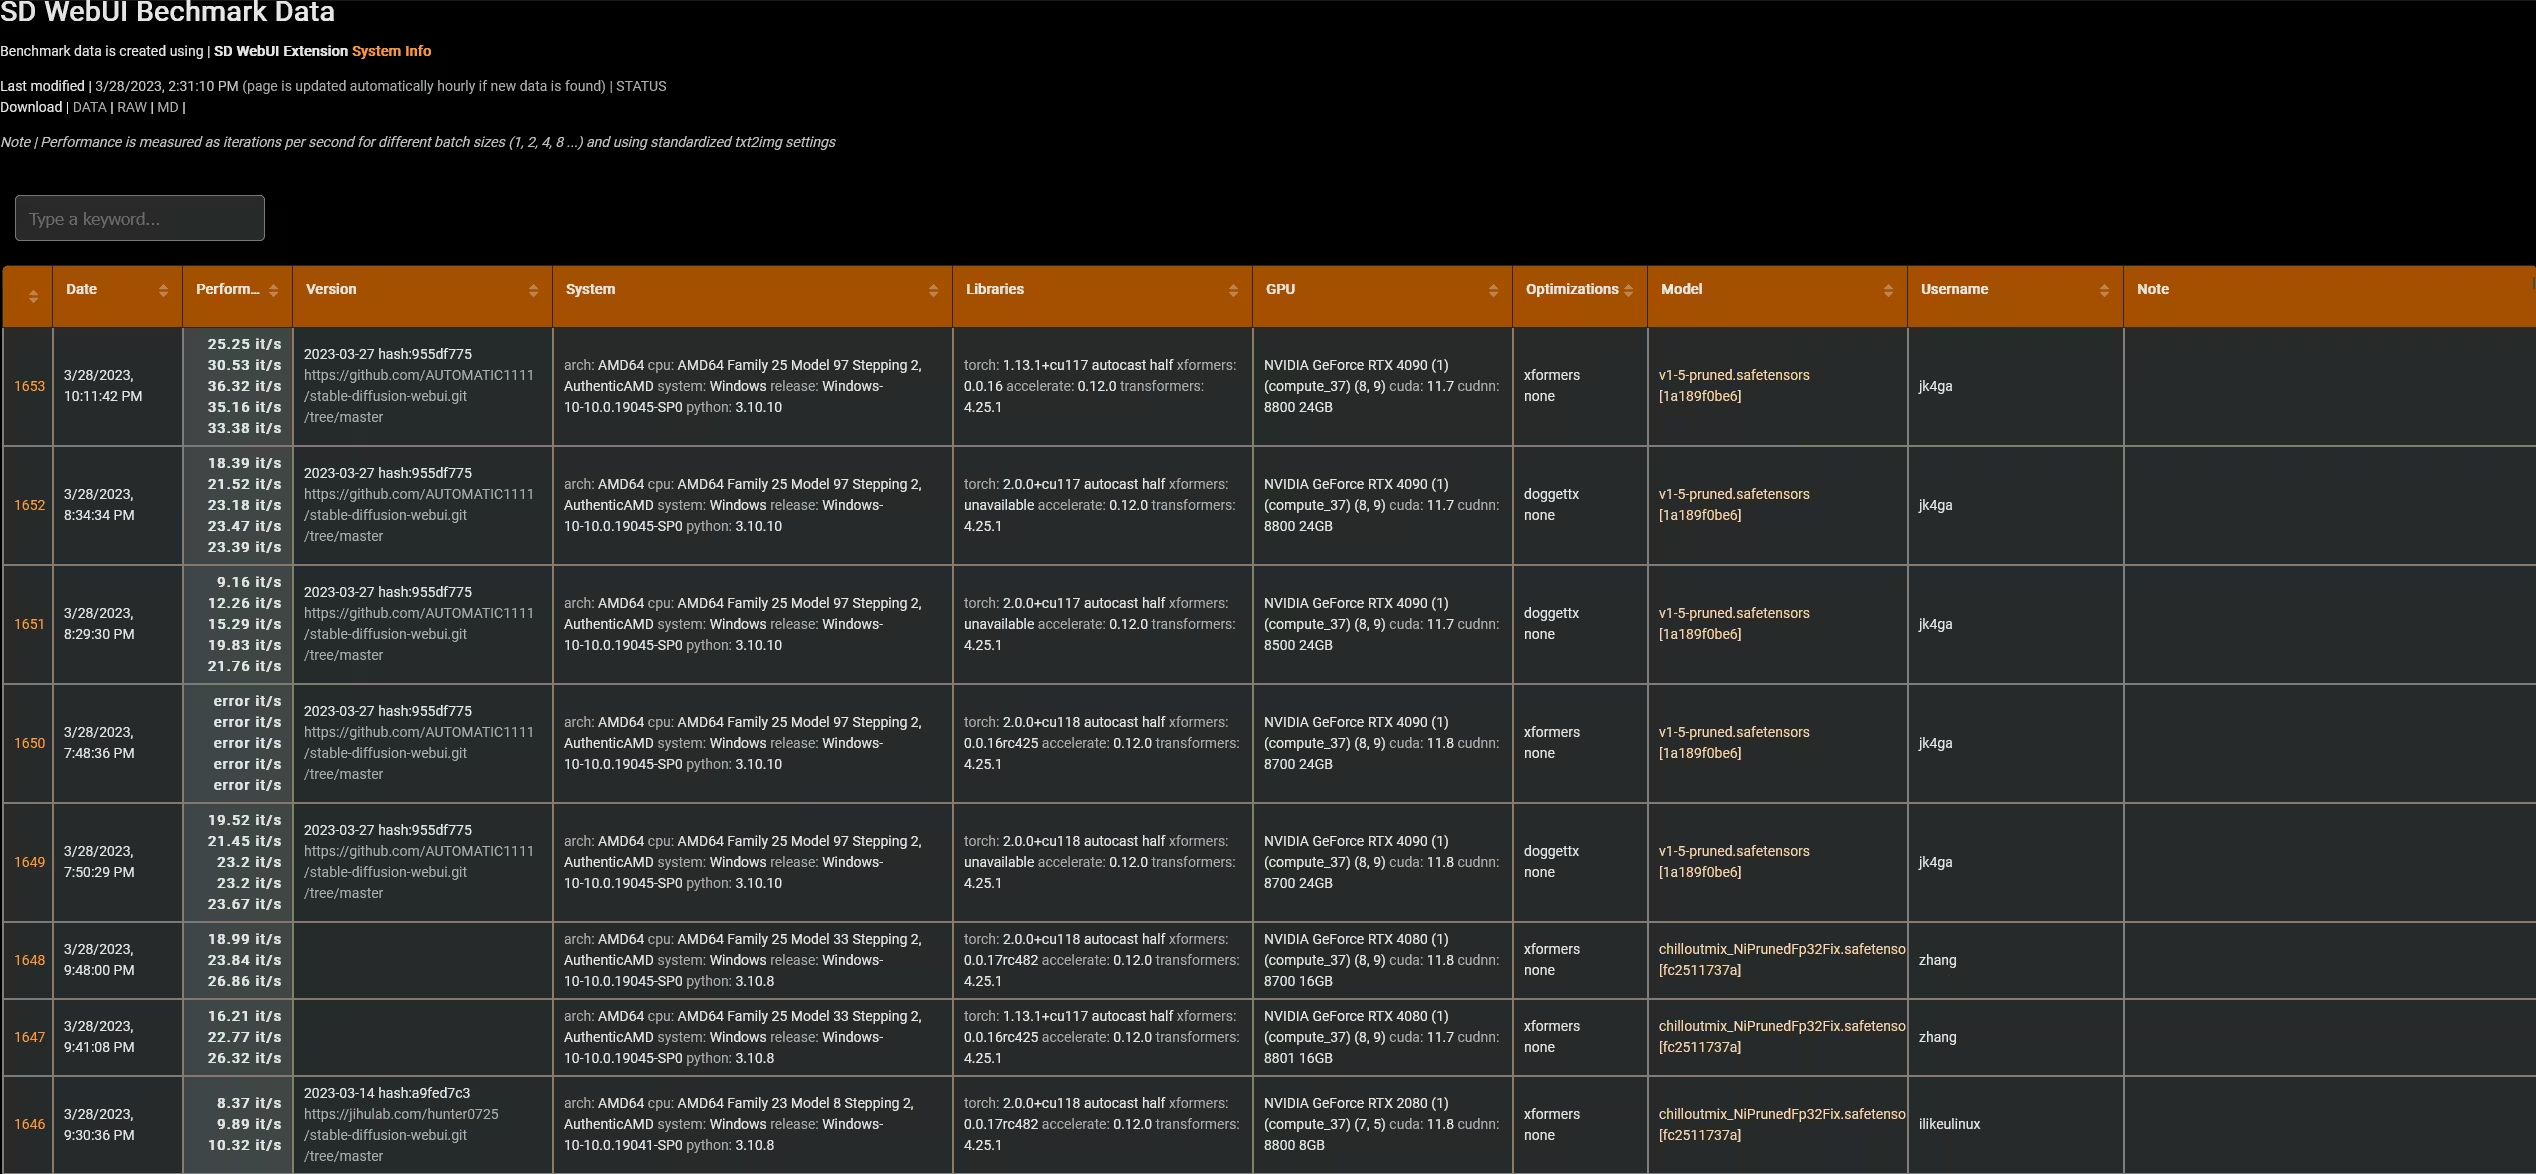
-
sdperformance The one covered in this article, made by me

Table
The table contains information:
- GPU Model
- OS
- Core Clock
- VRAM Mode
- xformers
- image creation progress
- no-half-vae
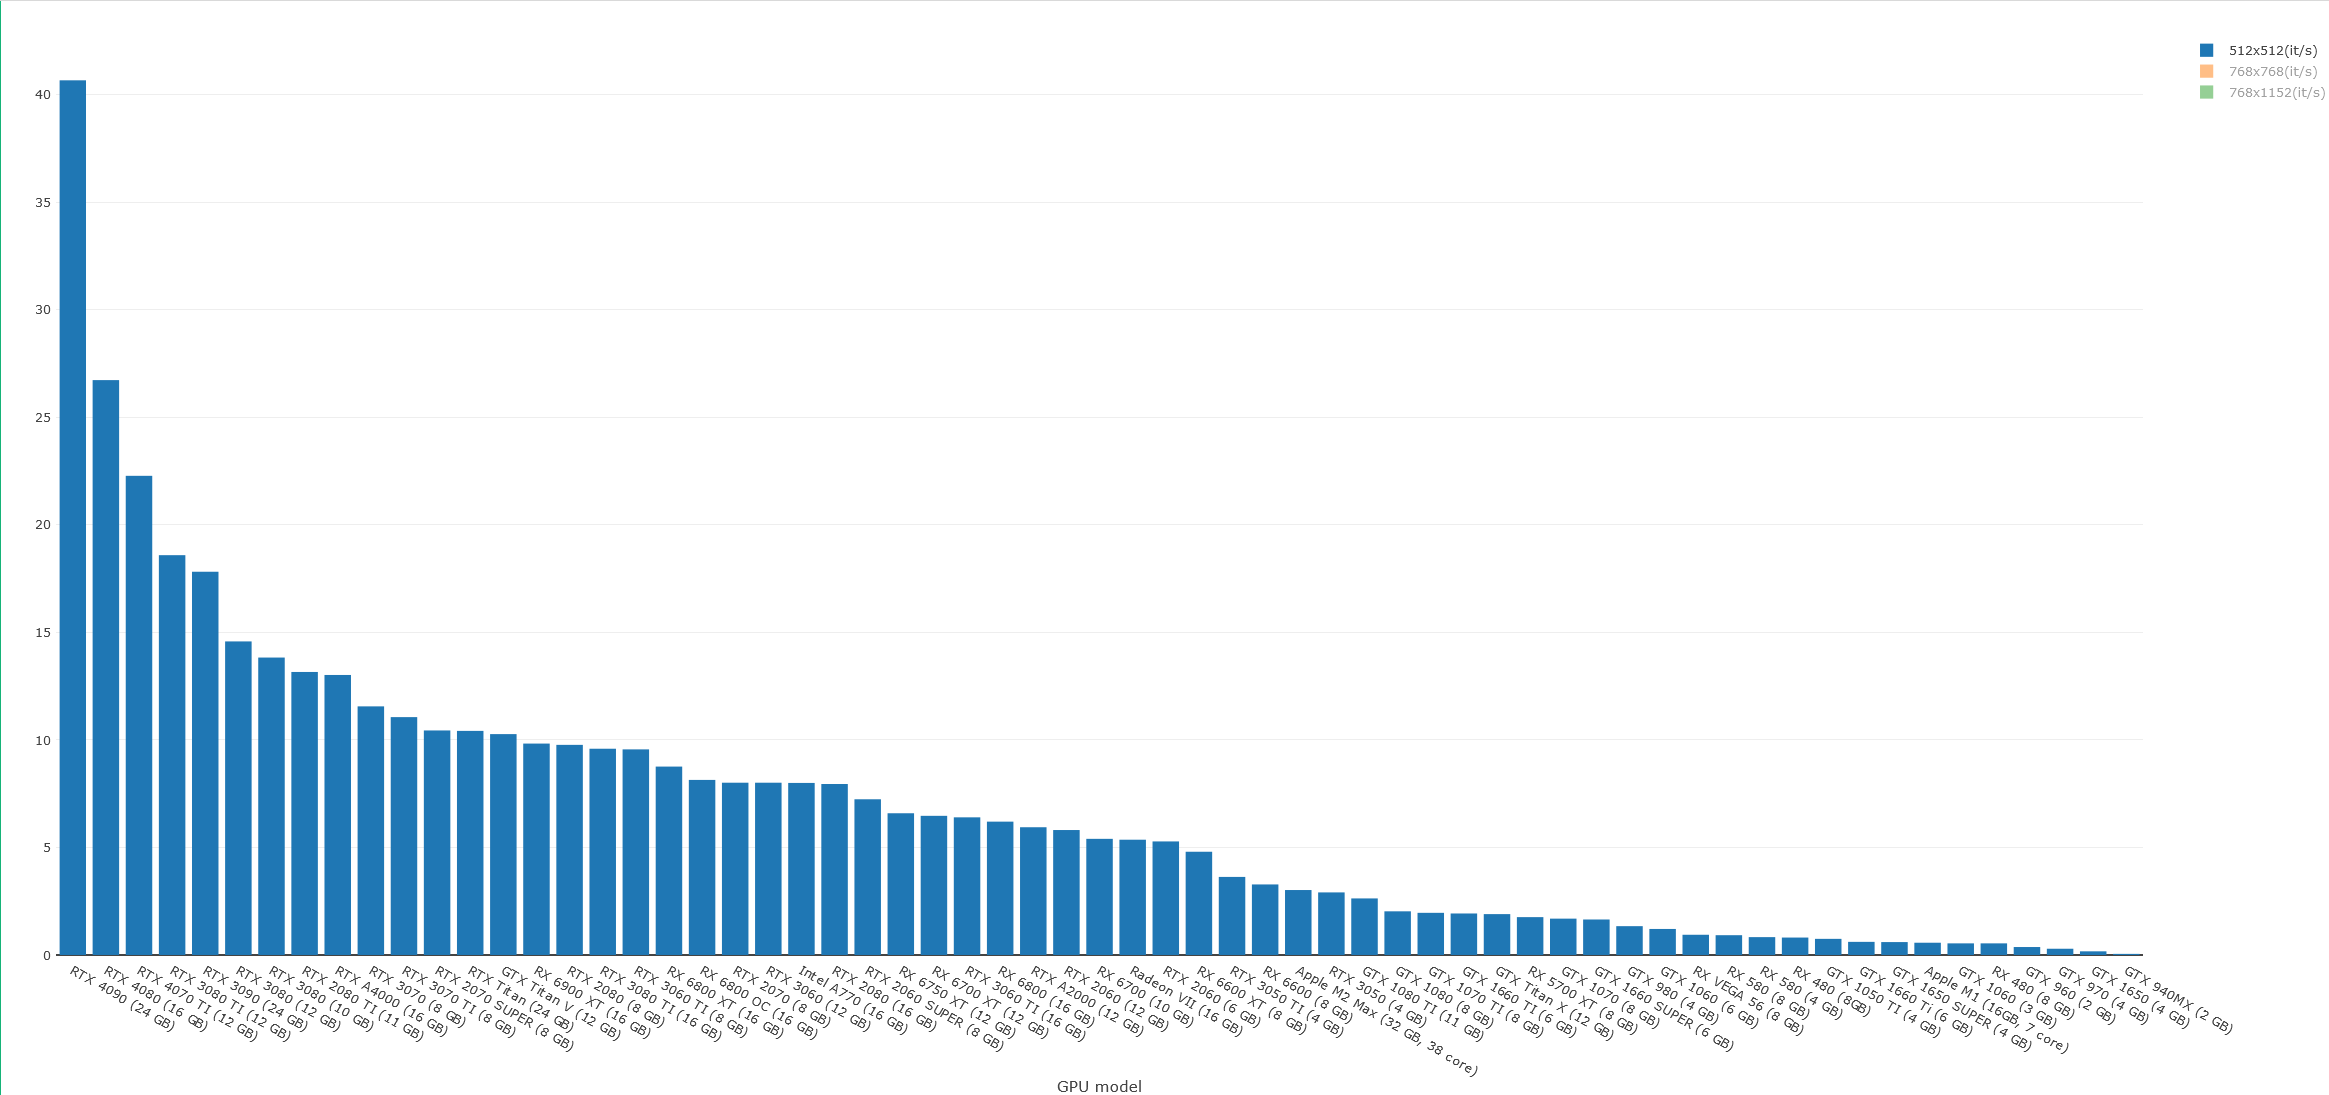
- 512x512(it/s)
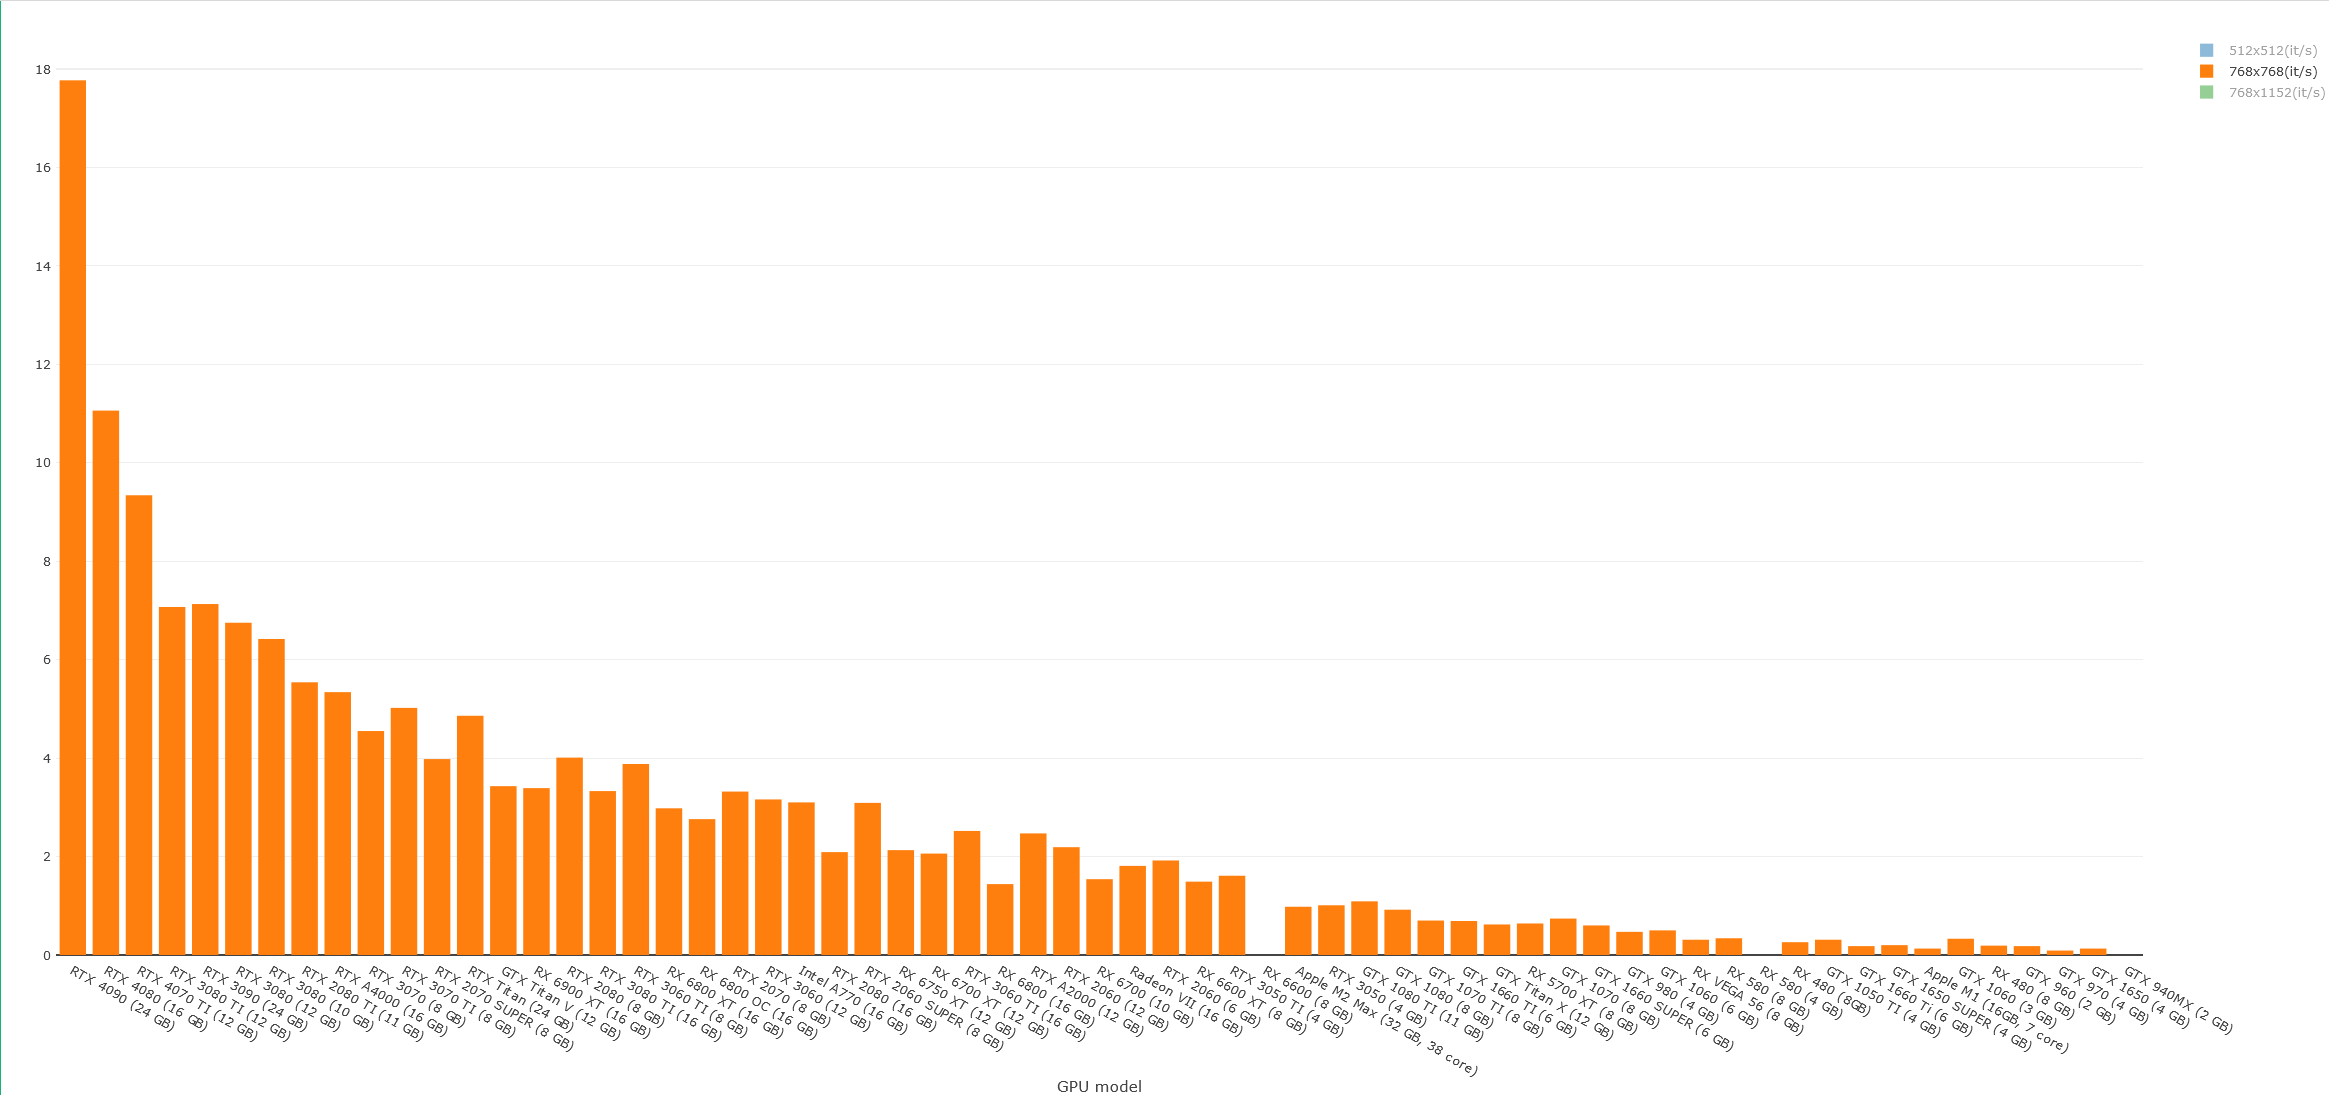
- 768x768(it/s)
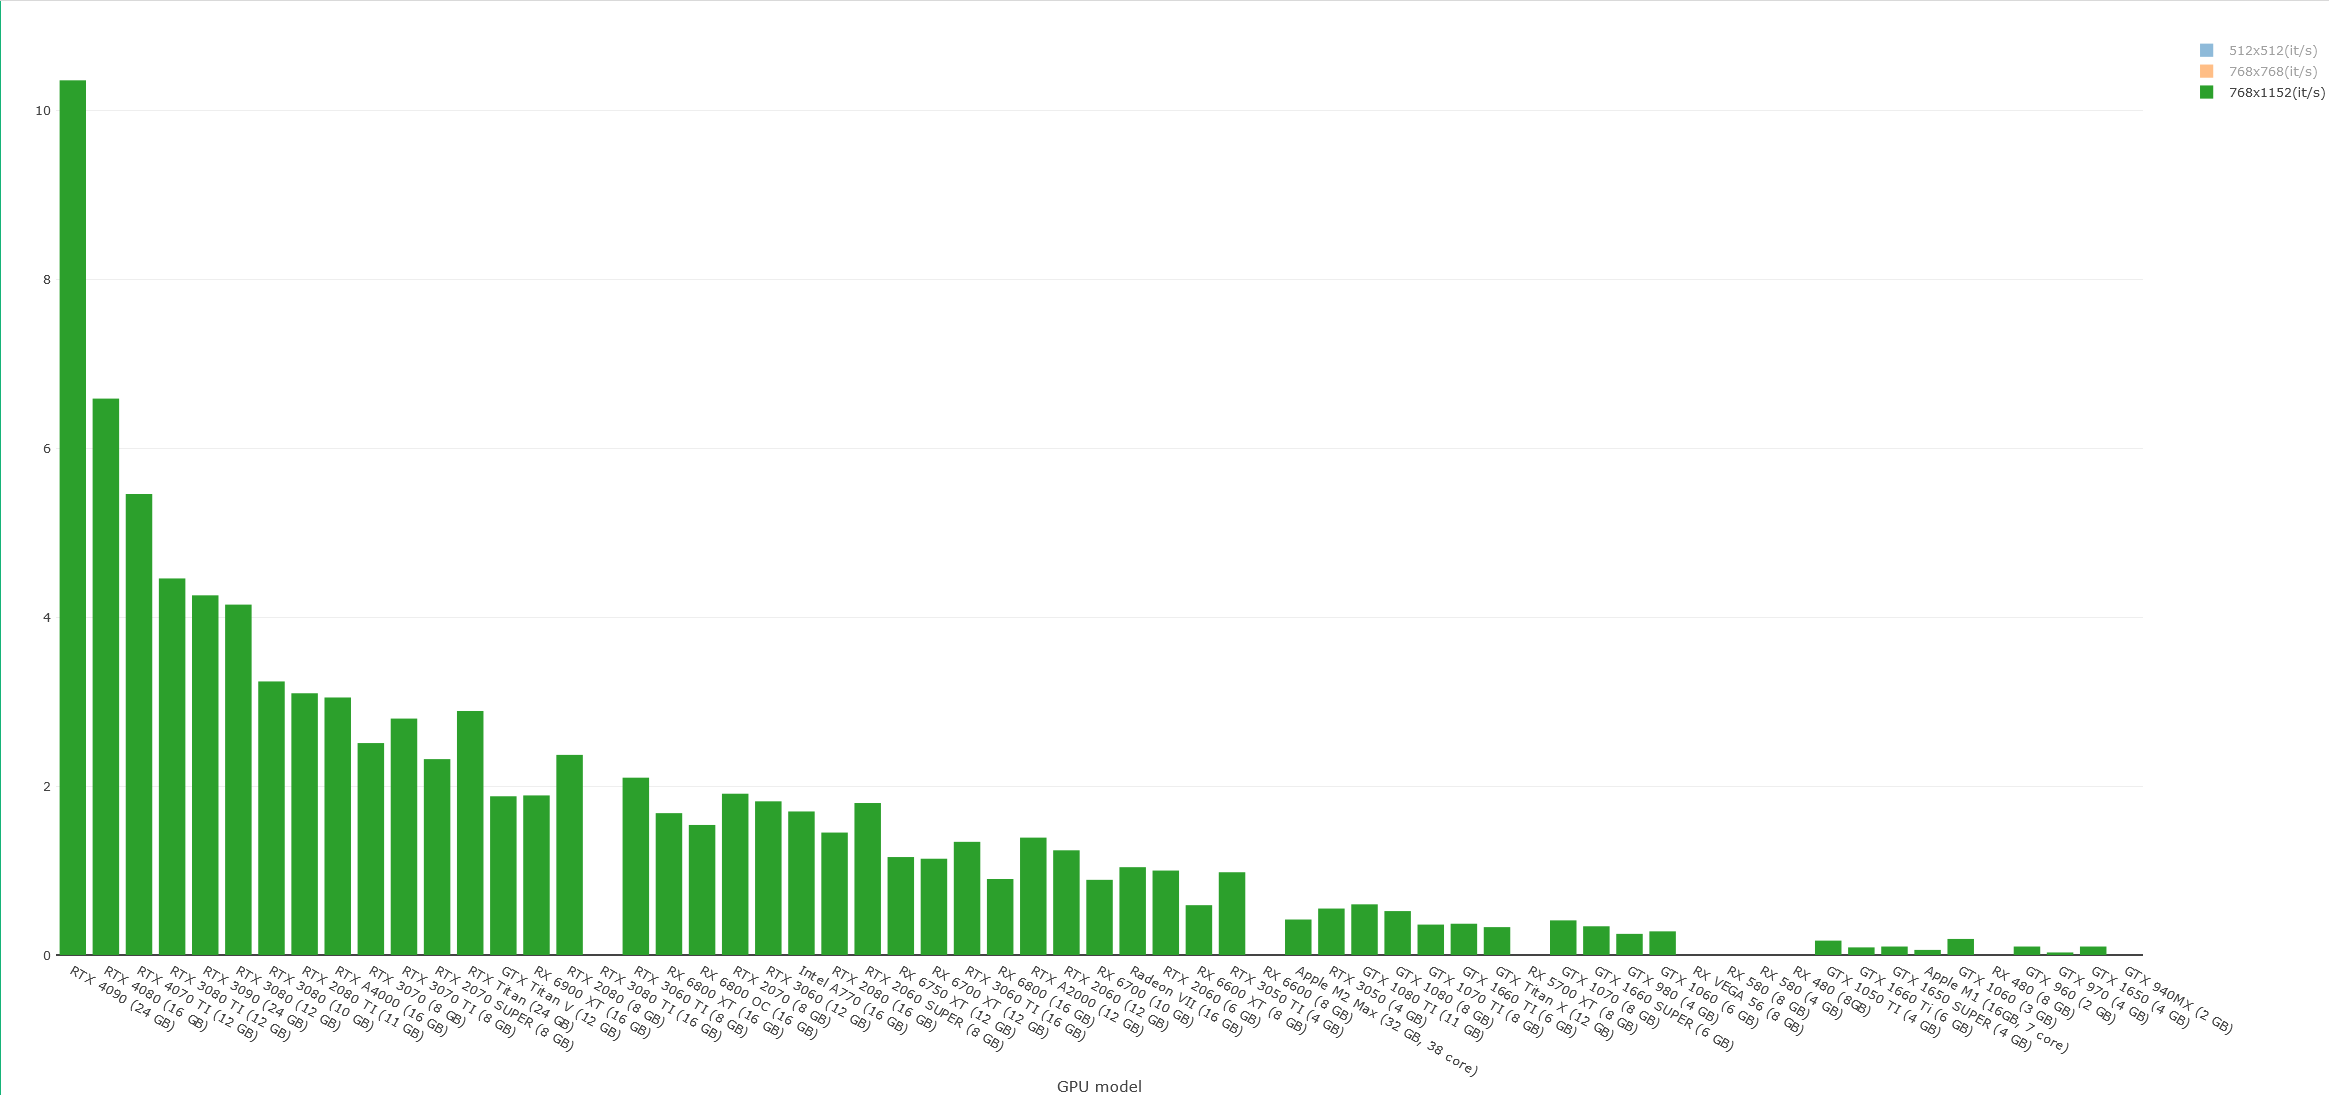
- 768x1152(it/s)
- Additional info
- Created
It is interactive so you can easily filter stuff you want to see
Benchmarking
Data is gathered by community submits, via form with normalized benchmark method, the benchmark specifies values like:
- Resolution
- Sampler
- Model
- Steps
- Amount of tokens
You can test and submit you data here: https://usem.liberaforms.org/sdperformance
Chart
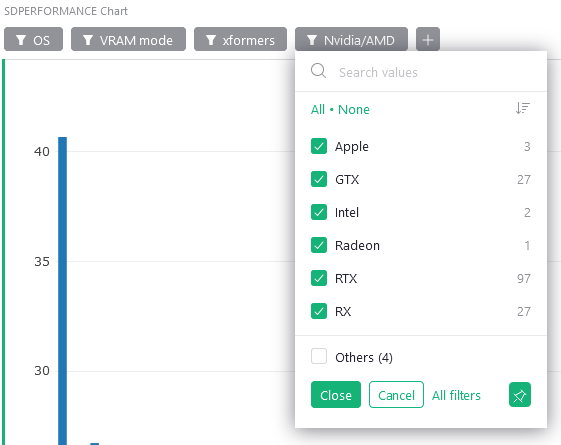
There is also chart version, showing highest it/s value for model, it’s fully interactive as well You can filter by GPU brand, xformers, OS and see the value for diffrent resolutions.


